
Three years ago I explained how to use photographs to estimate the speed of a passing car. You can read that article at https://physbang.com/2020/08/02/keep-the-cogs-turning/. Now it is time to use a similar technique to answer a more challenging question: what is the take-off velocity of a passenger jet?
Of course, the answer could be found simply using online resources such as those listed at the end of this article. But that would be too easy! In any case, the published data may not be accurate for a specific situation. It would be better, and much more fun, to find a way of estimating the answer first-hand.
But first a quick clarification of terminology. Speed is the rate of change of distance whereas velocity is the rate of change of distance in a particular direction. When an aircraft is taking off, its direction of movement is fixed by the direction of the runway so velocity is more appropriate than speed in this context.
Building on the method explained previously, we can estimate an aircraft’s take-off velocity by analysing a series of photographs taken with a known time interval, as illustrated below.
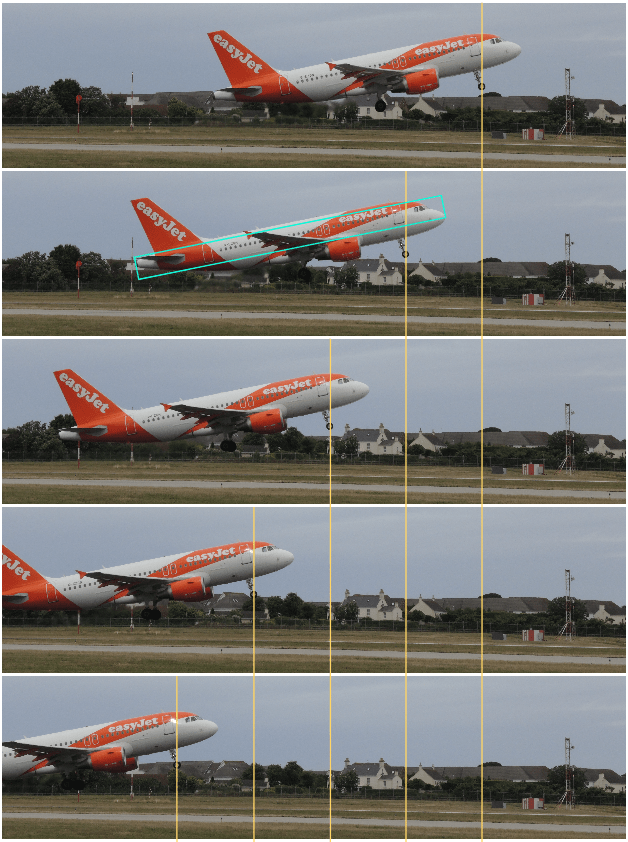
The pictures show an Airbus A319-100 leaving Jersey airport and were captured using a Nikon P7800 digital compact camera. By marking the position of the same feature in each picture (in this case, the axle of the nose wheel) it is possible to check how far the aircraft moved during the time interval between each frame. If the camera captured pictures at a constant rate and the aircraft had a constant velocity then the distances should have a constant length. Measuring the distances on an enlarged screen-image gave lengths (in centimetres) of 6.7, 6.6, 6.5 and 6.6, giving a mean value of 6.6 cm.
The camera used has a claimed maximum capture rate of “about 8 fps” (frames per second) which corresponds with a time interval between each picture of 0.125 s. By dividing the mean distance by the picture interval, the mean velocity can be calculated to be 52.8 (6.6 / 0.125). The units for this number are centimetres-per-second but this is simply the aircraft’s velocity at the scale of the picture. To get the aircraft’s real-life velocity we need to magnify the calculated value by whatever factor is needed to enlarge the pictures up to life-size.
In the same screen-image that gave average movement distances of 6.6 cm for each picture interval, the length of the aircraft fuselage was 27 cm. The full-size length of an Airbus A319-100 is 33.84 metres, or 3384 cm. So the magnification factor required to bring the photographs up to life-size is approximately 125x (3384 / 27).
When the picture-scale velocity of 52.8 cm/s is magnified by the magnification factor of 125x, we get a final answer of 6600 cm/s. This is the same as 66 m/s, which in turn can be converted into kilometres-per-hour, giving just under 240 km/h.
So our estimate for the aircraft’s take-off velocity is about 240 km/h. Published figures for aircraft performance are usually given in knots, kt, but they can easily be converted for comparison here. As it happens, 240 km/h is only 4% less than the published take-off velocity of 250 km/h (135 kt). That is a very satisfying result and suggests that the method used is a good approach to remote measurement.
Aircraft data is available on the eurocontrol.int website. For A319 information, the link is https://contentzone.eurocontrol.int/aircraftperformance/details.aspx?ICAO=A319.
Live flight information is available on various websites, including; https://flightaware.com/live/, https://www.flightradar24.com, and https://planefinder.net/.
