
For hundreds of years, water waves have been used to understand wave behaviour in general. This is understandable given that water waves are a natural phenomenon that can also be created artificially and studied in the lab.
On the simplest level, a stone thrown into the middle of a pond will create waves that extend outwards and travel across the water to the edge of the pond. If we know the distance from the edge of the pond to the point where the waves were created, and we use a stopwatch to time how long it takes the first wave to make this journey, then we can calculate the speed of the wave using the general equation;
speed (m/s) = distance (m) / time (s)
This equation is easy to use for the first wave, which is easily observed, but it is much harder to measure the time for the second, third and subsequent waves to check that they move at the same speed as the first wave.
Fortunately, there is a different approach that can be used. This relies on the equation that can be used to find the speed of a wave based on the properties of the wave (rather than the properties of the space through which the wave is moving). This equation states;
wave speed (m/s) = wavelength (m) x frequency (Hz)
There is a special piece of apparatus that is used for this investigation, called a ripple tank, that has a shallow glass tray of water with a light source above it. When small waves (ripples) are created on the surface of the water, a shadow pattern is cast on the floor underneath the tray. The equipment that we have in school uses a tilted mirror to project the pattern onto a vertical screen, which is easier to observe.
The key component in a ripple tank is a motor that generates a continuous sequence of waves. The rate at which the motor rotates determines the rate of wave generation, which is the same as the wave frequency: this number is shown on a digital display.
The waves would still be very difficult to observe (just as they would on a pond) were it not for a very clever trick that comes to our rescue. If the light source is made to flash at exactly the same frequency as the waves are generated then the waves will appear to stand still. (This is the same effect that is used in strobe timing lights used to check the set-up of car engines.)
So now we have an system that provides a frozen image of the wave pattern. We know the frequency of the wave (from the digital display) and we can measure the wavelength as the distance between two dark bands (two wave crests) on the shadow pattern.
NOTE: It would be better practice to measure the distance between multiple wave crests then to divide by the number of waves to get a more accurate figure for one wavelength. Effectively, this is the same as repeating the measurements, which is always a good idea in any experiment.
Remember that the number of waves is always one less than the number of crests (dark lines) because you need two crests to work out one wavelength.
There is a worksheet attached for you to calculate the mean speed for waves in a ripple tank. To download the worksheet, click here. You will need to refer to the information given above to complete the worksheet task. I should add that this sort of task is the type of exercise that could be set as an examination question based on the required practical, so I strongly recommend that you download the sheet and have a go at it!
Those of you who want to stretch yourself may like to read on. Note that the following section goes beyond the basics that you need for the GCSE Physics course.
It turns out that despite being convenient (and having been used by leading C17th physicists Christiaan Huygens and Robert Hooke to explain the behaviour of light) water waves are more complicated than we have assumed here. For one thing, water is a dispersive medium, which means the speed of a wave varies with its frequency. This is true of ripples and is also for light travelling through water, which explains why we see rainbows in the sky.
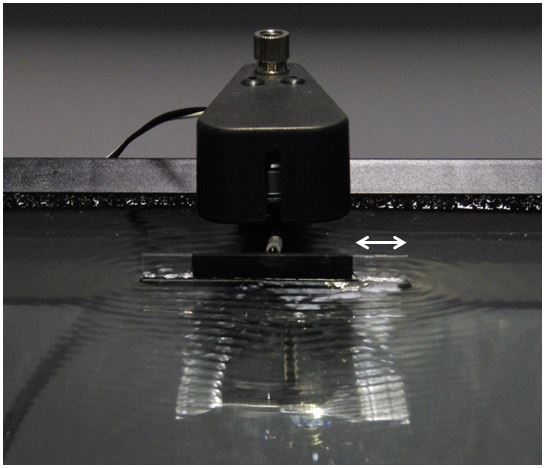
A more detailed set of results recording the frequency and the calculated wave speed for a ripple tank experiment is available here. These data also include an allowance for the magnification factor introduced by projecting the wave pattern onto a screen. The original waves being generated by the motor are shown in the photograph below. The marker provides a scale for estimating the true wavelength of the ripples that are being generated. It is obvious that the wavelength is very short – certainly less than the lengths measured on the screen. (The magnification was determined by placing an opaque object in the empty water tank then comparing the size of the projected image with the dimensions of the object itself.)
For a challenge, can you use the detailed data to determine a relationship between the wave speed and the frequency? GCSE Physics assumes that the wave speed is independent of frequency but these data clearly show that is not the case and demonstrates that water is a dispersive medium, as stated above.
If you aren’t sure how to start then plot a graph of these two variables using Excel, RJS Graph (available from http://www.rjsweb.net/) or any other analysis program to find the equation of the line. This task is well above GCSE requirements but I would be interested to know how you get on.

One thought on “Speed of Water Waves”