
The obvious way to classify stars is by their appearance; how bright they are and their colour. In both cases, we are referring to properties judged using the human eye from the location of planet Earth.
Sadly, our eyes are not a good judge of colour (equal amounts of red and green light are perceived as the colour yellow) and visual brightness depends both on a star’s luminosity (its “true” brightness) and its distance from Earth. Fortunately, spectroscopy can help by revealing the peak wavelength in a star’s light, which is due to its temperature, as well as the presence of absorption lines, which are due to substances in the star’s outer layers. These two features are used to classify stars.
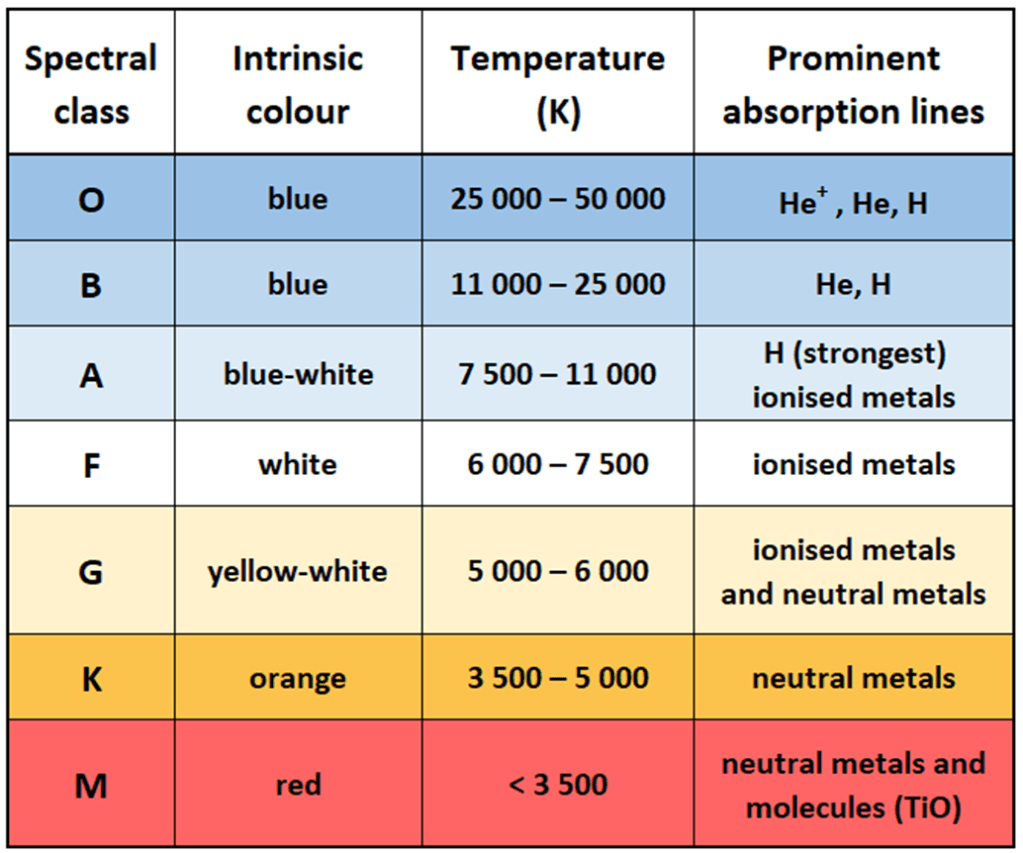
The key facts for star classification can be condensed into a short table that lists spectral class with surface temperature and the main absorption lines seen in the visible part of the electromagnetic spectrum. First developed by Annie Jump Cannon, this method of classifying stars is known as the Harvard system. The version shown below was created using the information contained in the current AQA A-level Physics specification.
Although it may not be immediately obvious, the absorption lines are not random but instead follow a pattern that has hydrogen at its heart. The importance of hydrogen is not surprising given that hydrogen fusion is the mechanism that causes stars to shine.
The significant hydrogen lines are the Balmer series, which fall in the visible-light part of the electromagnetic spectrum. These lines are due to electrons that are already partially excited (occupying the first energy level above the ground state) being excited further into higher states.
You might well ask, what causes the electrons to be partially excited in the first place? The answer is energy transfers from thermal collisions. In other words, a star that has just the right photospheric (surface) temperature will have plenty of hydrogen electrons in the n=2 energy level and will therefore show strong Balmer-series absorption lines.
Any star that is a little cooler will have most of its hydrogen electrons in the n=1 (ground state) energy level. These electrons cannot produce Balmer-series absorption lines. Similarly, any star that is hotter than the ideal temperature range will have its hydrogen electrons in higher energy states, possibly even stripped away, and they too will therefore be incapable of producing Balmer-series absorption lines.
A stellar classification table using data from a different source, with an additional summary column stressing the appearance of the hydrogen (Balmer) lines, is shown below. Note that the stated temperatures differ slightly from those given in the AQA table, and other sources may differ again, but the underlying pattern is always the same.

We are now able to explain which absorption lines dominate at different temperatures by thinking about the likely electron energy levels for different materials that may be present in the outer layers of different stars.
At lower temperatures, the absorption lines will be due to compounds, specifically titanium oxide, where electrons are easily excited because they are not tightly bound to one particular atom.
Slightly warmer stars have enough energy to cause electron energy-level changes in metals, where we know that electrons can easily enter a higher-energy state because they move into the conduction band when metals are in a solid state. As the temperature rises, some metals will become ionised so the lines will be a mixture of absorptions from neutral and ionised metals.
We then progress through the temperature region where the Balmer-series hydrogen absorption lines come into play, initially in combination with ionised metals and later in combination with neutral helium. As the temperature continues to rise only inert helium atoms will avoid ionisation. The cross-over point for the change of dominance from hydrogen to helium occurs at about 20,000 K but at still-higher temperatures even neutral helium gives way to ionised helium.
Given this pattern, the characterisation of stars by their dominant absorption lines becomes logical rather than (apparently) random;
- M-class stars’ spectra are dominated by titanium oxide and neutral metals
- K-class stars show strong lines due to neutral metals together with ionised metals
- G-class stars have strong lines due to ionised metals and weaker lines due to neutral metals with clear (emerging) hydrogen Balmer lines
- F-class stars have a spectrum that contains absorption lines for ionised metals and hydrogen Balmer lines
- A-class stars have the strongest hydrogen Balmer lines with fading lines due to ionised metals and emerging helium lines.
- B-class stars’ spectra are dominated by neutral helium with distinct hydrogen lines
- O-class stars are so hot that helium lines dominate, in both neutral (fainter) and ionised (stronger) states
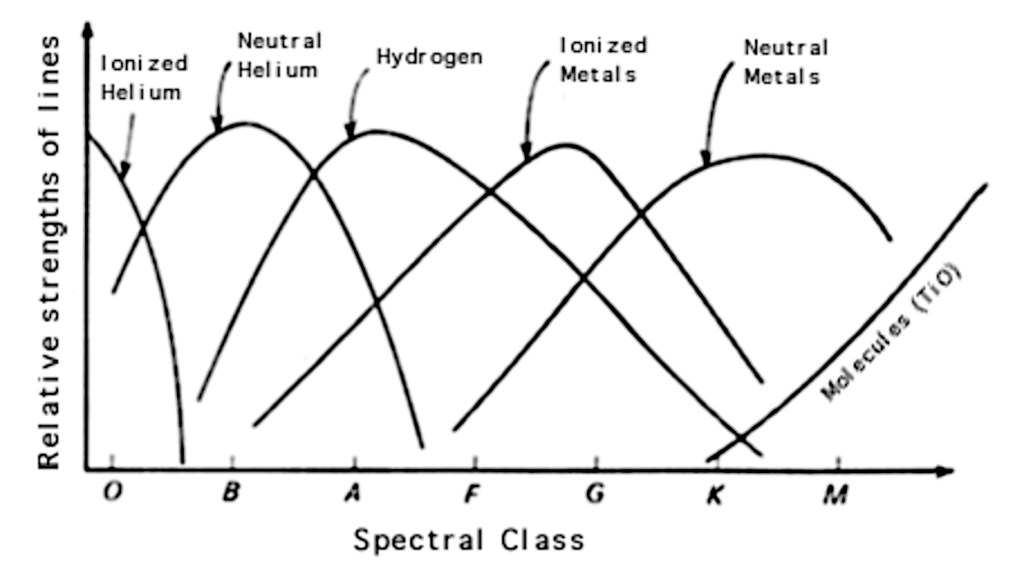
These trends are illustrated in the diagram below.
There is a component missing from the preceding discussion; luminosity. It has been omitted because it is not part of the AQA A-level Physics syllabus but it is necessary to avoid ambiguity in the HR diagram, where every star that has the same temperature would seem to fall in the same (Harvard) class despite the fact that this would blur the distinction between, for example, red giants and red dwarf stars on the main sequence. This level of detail goes beyond what is required for A-Level Physics.
There is a separate post about the HR diagram, which also includes other important information about star characteristics, at https://physbang.com/2024/03/18/the-hertzsprung-russell-diagram/.
Further reading: For more information, I recommend The Stars and the Interstellar Medium, which is the first textbook for S281, the Astronomy and Planetary Science course from The Open University. Although it is not always the case, there is also good information on Wikipedia about star classification, at https://en.wikipedia.org/wiki/Stellar_classification.
