
At GCSE level, beta decay is said to be the emission of an electron (or positron, in beta-plus decay) when an unstable nucleus transforms into a more stable nucleus. The parent and daughter nuclei are different elements with the same nucleon number (sum of neutrons and protons) but their proton numbers vary by +1 for electron emission or –1 for positron emission.
At A-level, the picture is extended by adding neutrinos. The need for neutrinos was originally based on the realisation that beta particles can have a range of energies even when they come from the same parent-daughter decay. That observation seemed to contradict the conservation of energy so in 1930 Wolfgang Pauli proposed the existence of a new particle. This new particle was initially undetectable but it was required to carry some of the energy liberated during beta decay, with the remainder of the energy being conveyed by the electron (or positron).
In accordance with the conservation of energy, the sum of the energies for the electron and the new particle must always be the same even though the allocation of those energies can vary, as shown in the left-hand diagram below.
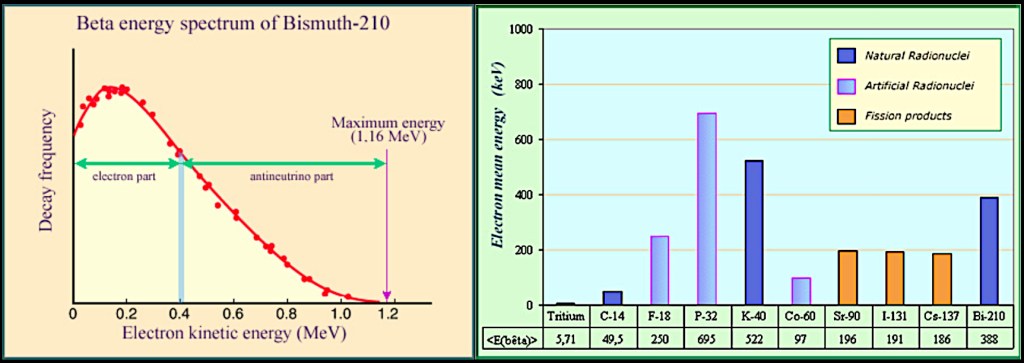
The allowed variation in electron energy could lead to ambiguity as it may be difficult to determine the parent and daughter nuclei involved a particular beta decay. Fortunately, the mean electron energy is characteristic of each individual decay, with some having very similar mean energies but others being hugely different, as shown in the right-hand diagram above.
Although what follows goes beyond the A-Level Physics syllabus, it is interesting to consider the effect on the beta energy spectrum caused by the neutrino’s mass, which was originally thought to be zero but is now known to be finite, albeit very, very small.
According to the original assumption of zero mass, if we subtract the exact mass of the daughter nucleus from the mass of the parent nucleus, then also subtract the mass of the emitted electron, the remainder must be mass that is converted into energy and released during the reaction.
In terms of equations, we can calculate the “missing” mass using the following equation;
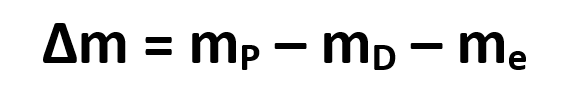
We can then use Einstein’s mass-energy equation to convert the mass deficit into liberated energy;

The final equation produces a parameter known as the Q-value for the decay, which is the total amount of energy liberated. This in turn gives the value for the sum of the electron energy and the antineutrino energy, as represented in the spectrum shown above.
But the non-zero mass of neutrinos and antineutrinos means this isn’t quite correct and the amount of energy available to the lepton particle-antiparticle pair (electron and antineutrino, or positron and neutrino respectively) is actually slightly less than the equations suggest.
A non-zero neutrino mass means there is an extra term that should have been included when calculating the Q-value. Or to put it another way, the cut-off value for the total lepton energy will be less than the Q-value by an amount corresponding to the rest-mass energy of the neutrino. Given that neutrinos are hard to detect, the best way to investigate the discrepancy will be by measuring the greatest observed electron energy, when the hard-to-measure neutrino energy will be as close to zero as possible. The top end of the beta energy spectrum will then resemble the diagram shown below.

The deviation in the beta energy spectrum shown above looks appreciable but the axes’ scales have been greatly enlarged and the 15 eV deviation represents an energy reduction of just 0.08 %. As if that weren’t tricky enough, the neutrino mass is now known to be much, much lower, equivalent to less than 1 eV, so it is easy to see why the beta curve is generally, and very safely, taken at face value. That said, neutrino studies are very much cutting-edge physics so we should always remember that the usual beta energy curve hides some significant details.
Readers who wish to find out more about neutrino-mass measurements, based on recent tritium beta decay experiments, should read the 2022 KATRIN Collaboration report, Direct neutrino-mass measurement with sub-electronvolt sensitivity, which is available as an open access Nature Physics paper at https://www.nature.com/articles/s41567-021-01463-1.
Historical footnote. Wolfgang Pauli originally called his particle the neutron, because it had to be electrically neutral and the name followed the existing pattern for protons and electrons. But it was only a theoretical particle so the name “neutron” was transferred to the heavy neutral particle that James Chadwick discovered in 1932. Nevertheless, Pauli’s neutral particle remained an essential ingredient in beta decay so it needed a new name, which it got when Enrico Fermi christened it the neutrino (little neutron). Neutrinos are completely different from neutrons in more ways than simply mass but the names have stuck. More information about the history of beta radiation, inspired by Carsten Jensen’s excellent book Controversy and Consensus: Nuclear Beta Decay 1831-1934, is available in a previous post, https://physbang.com/2025/07/20/beta-decay-and-energy-conservation/.

One thought on “Beta Decay Q-value”