
In school we talk about different ways to generate electricity as a potential exam topic but it’s much, much more important than that. Russia’s war with Ukraine has brought this fact sharply into focus as people start talking about a boycott of Russian oil and gas. At the same time, the UK is phasing-out its nuclear power stations (see this previous post) so how are we going to generate electricty in the future?
A fantastic source of information to help answer this question is Kate Morley’s excellent grid.iamkate.com page, which provides a real-time display of the renewable and non-renewable resources that are being used to generate the UK’s electricity right now.
Shown below are three screen-grabs for different energy demand and generation situations over the course of a week in April 2022. One of the key skills for GCSE Physics is the ability to describe what is shown by diagrams such as these: so, what can you say about the tactics the UK uses to balance electricity demand against the available energy sources? Total demand is shown in the grey panel on the left and the contributions from each type of energy source are shown in the coloured panels. At this stage, you can ignore the Interconnectors panel, which refers to the import/export of electricity through cable links with other countries to ensure that the net figures for generation and demand always total 100 %.


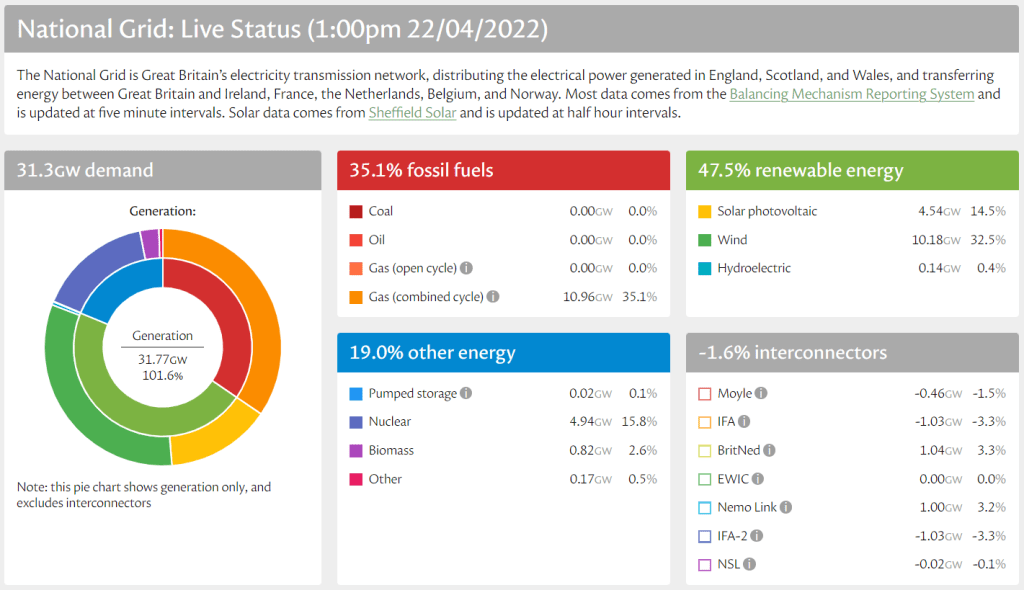
You will notice that UK electricity demand varies a lot: it can even drop below 20 GW in exceptional circumstances, although none of these examples show that. Predictably, there is a greater contribution from solar energy in the middle of the day when the weather is sunny (as in the middle and bottom diagrams) but you might be surprised to see that considerably more energy can be obtained from wind power under favourable conditions (bottom diagram). Nuclear stays fairly constant, at 5-6 GW, and this can cover up to about 25 % of demand. But the big shock is fossil fuels. The UK has made much of dropping its use of coal to zero but look at gas, which met as little as 14.1 % of demand in one scenario (middle diagram) rising to roughly 50 % in another scenario (top diagram).
In fact, things can be worse than that… At 7:20 am on 2nd May 2022, 80 % of the UK’s 24.1 GW demand for electricity was met by burning gas! Nuclear provided its usual baseline but the total for solar, wind and hydroelectric taken together was just 4 %. That was early in the morning (low sun angle) on a day with very little wind – see below.
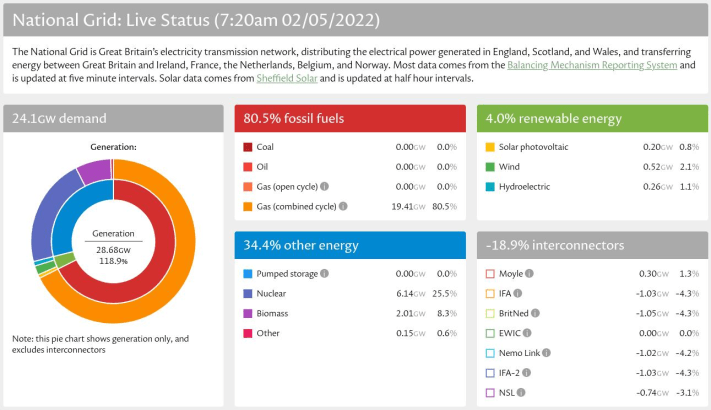
The astute amongst you will spot that, in the data above, the UK was actually generating more electricity than it needed, which was something of a shot-in-the-foot for the country’s ambitions in terms of carbon emissions! It’s great that we were exporting electricity to other countries (shown in the Interconnectors panel) but not that we were buring gas to do this. But it would have been excusable if this was to subsidise countries who had less Russian gas. These things are rarely as simple as they sometimes look at first sight.
So here’s something to think about: if you were planning ahead for the future generation of electricity in the UK, which resource(s) would you want to have available, in what quantities, and why? The exam board could ask you to compare the benefits and risks of different energy sources but remember that this is applicable to real life as well. Let’s hope that our politicians are also giving this serious thought, even if they won’t be sitting a GCSE Physics examination in the summer. Come to think of it, maybe they should?!
On a smaller scale, here are two more items that could be of interest and help to develop your understanding of electricity generation on a much smaller scale.
The first concerns a portable wind turbine called Shine: full details are on the Indiegogo crowdfunding platform here. It’s small enough to fit in a pack-back, has a mass of under 1.5 kg, takes about two minutes to assemble, can be used in a wide range of wind speeds and is capable of generating in excess of 40 W.
The graph below shows the relationship between wind speed and electricity output for a Shine wind turbine. You should be able to describe this graph but don’t just say “when the wind speed goes up, the power goes up”: that won’t get you full marks in a GCSE Physics exam! Talk about the shape of the line and even give some numbers to illustrate your decription. HINT: Take two wind speeds that are a multiple (such as double) and see if the power values are in the same ratio.

The second item is a news story reporting the successful trial of a battery that uses algae photosynthesis to convert light energy into electricity. It is about the same size as an AA cell and is the result of a project between the University of Cambridge (Biochemistry Department) and the ARM microprocessor development company. The light-sensitive cell would obviously have to be installed so that light can reach it (not inside a black plastic TV remote control, for example) but it does keep working when the light levels dip! You can read more about this on TechXplore.
