
Acceleration is the rate of change of speed (we will leave aside velocity for now) and that means we can calculate acceleration if we know the speed of an object at two different times. The object’s acceleration is given by its change in speed, divided by the time interval.
Positive acceleration indicates that the object is speeding-up whereas negative acceleration (also known as deceleration) indicates that the object is slowing down.
If we have a graph of speed (y-axis) against time (x-axis) then the gradient of the line of motion is equal to the acceleration of the object. This has been explained previously in a general way (see Speed and Acceleration for more details) but now we need to look at this idea mathematically to calculate a numerical value for acceleration.
To calculate the gradient of the line on a speed-time graph, we must choose two pairs of coordinates that are on the line. Note that the points must be on the line: try to avoid using the original data points, even if they are very close to the line.
By way of example, we will analyse the graph below, which shows the initial movement of a Saturn V rocket as it leaves the launchpad according to data provided in a NASA worksheet.
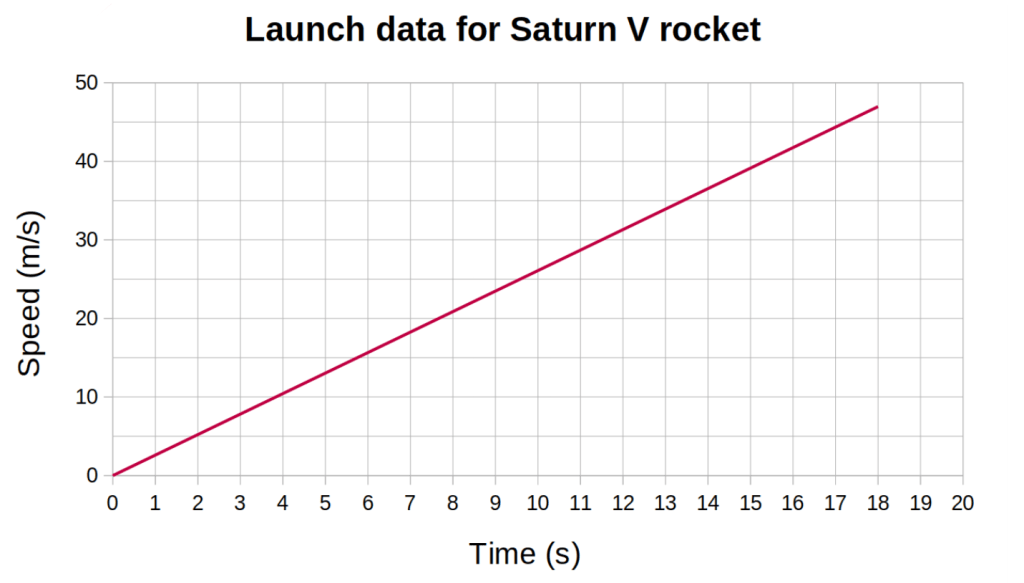
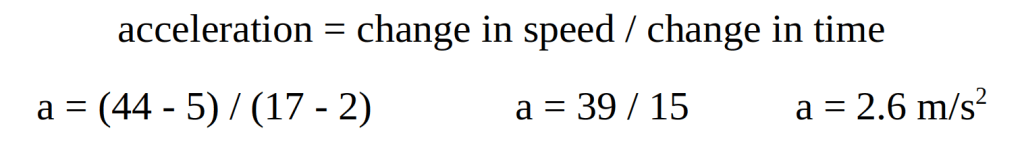
The gradient of the line is equal to the change in the y values (the change in speed) divided by the change in the x values (the change in time). On the graph shown above, in the time interval from 2 s to 17 s, the speed increases from 5 m/s to 44 m/s. We can therefore calculate the acceleration as follows;
As it happens, there is another way to calculate acceleration without using time: in view of the maths skills involved, this is particularly likely to come up in the Higher Tier paper but it could be in one of the questions that overlaps between the two tiers, so everybody needs to know the basic method. We’ll therefore cover that technique separately in the next article.
