
There is a required practical in GCSE Physics courses, including Trilogy, that involves calculating the specific heat capacity of different metal blocks. This is done by measuring the energy supplied (using voltage, current and time) and monitoring the temperature increase. You are expected to recall this experiment and be able to suggest how it could be improved (by applying insulation and ensuring a snug fit between the heater and the metal block, for example).
Commonly, the metals used for this practical are aluminium and copper. The textbook specific heat capacities of aluminium and copper are around 900 J/kg K and 390 J/kg K respectively. These are clearly very different values but it’s interesting to ask whether they are “random” values or whether they can be explained in any way.
We have seen previously (Magnificent Moles) that the idea of the mole came from thinking about there being the same number of particles in a fixed volume of gas, regardless of which gas is chosen. Is there any sort of equivalence for solids? And, if so, could this be a factor that helps to determine specific heat capacity?
To answer this, we need to look at the specific heat capacities for more than just two metals. It is important to take data from reputable sources so I first used my old copy of Nuffield Advanced Science Book of Data then turned to engineeringtoolbox.com, which covers even more metals.
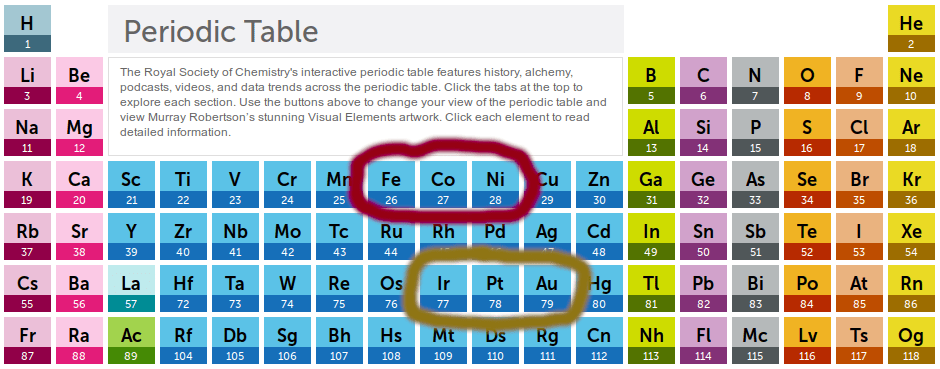
Scanning down the list, I notice that the specific heat capacity values for iron, cobalt and nickel are almost identical (around 440 J/kg K) and the same is also true for iridium, platinum and gold (all around 130 J/kg K). Do the members of these two sets of elements have anything in common? A quick glance at the Periodic Table shows that they form their own clusters (see below) and therefore they have very similar values for atomic mass. In fact, elements that are immediately adjacent to these clusters (including copper, at 390 J/kg K) also have similar values for specific heat capacity.
So here’s a thought; is there a relationship between relative atomic mass and specific heat capacity? More exactly, is it the case that when the relative atomic mass increases, the specific heat capacity decreases in a predictable way?
To explore this, let’s first remind ourselves that the specific heat capacity is the amount of energy needed to raise the temperature of 1 kg of a substance by 1 K (or 1 °C). But 1 kg contains different numbers of particles for different substances. If we had a way to take the same number of particles (instead of the same mass) would we find that the same amount of energy is needed to raise the temperature by 1 K?
To test the hypothesis, we’ll plot a graph that has specific heat capacity on the y-axis and the number of moles contained in 1 kg for each substance on the x-axis. If the heat capacity for one mole of particles has a fixed value, then we should get a straight line. The gradient of the line will give us a number for the fixed value, which we will call the molar heat capacity.
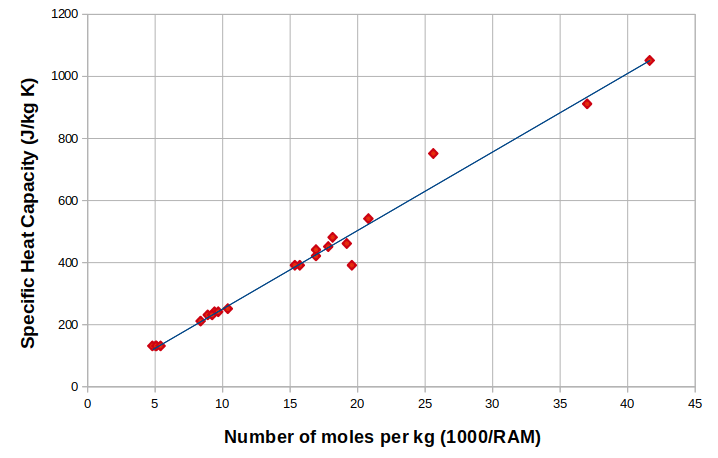
As the graph above shows, there is indeed a linear relationship between the two variables, so the idea of a fixed molar heat capacity looks valid. And appearances are not deceptive: even though different metals may have different specific heat capacities, they have the same molar heat capacity.
This fact is not in any GCSE Physics course but it’s a lovely result that reinforces the importance of the mole. So beautiful is this outcome that I think all GCSE physicists should have a chance to appreciate its simplicity and elegance.
Footnote: It’s worth adding that the mathematics behind the constant value go beyond GCSE level – and even then, the “constant” value doesn’t apply at very low temperatures. To find out more, look for information about the law of Dulong and Petit.
