
In the same way that surface colour affects the rate at which objects heat-up and the maximum temperature that they reach (as discussed here) so too will the surface colour affect the rate of cooling. As before, there is a standard experiment that you are expected to know and a typical set of curves that you need to be able to identify and describe.
The experiment uses boiling tubes with different surface colours; we had one dull black, one shiny silver and one clear glass. All three were filled with the same amount of recently-boiled water. They were then sealed with a bung that had a thermometer pushed through to the same depth. The purpose of the bung was to prevent heat loss by convection.
All three boiling tubes were then held in separate clamps and their temperature was recorded over a period of roughly an hour. The results were plotted on a graph, as shown below.
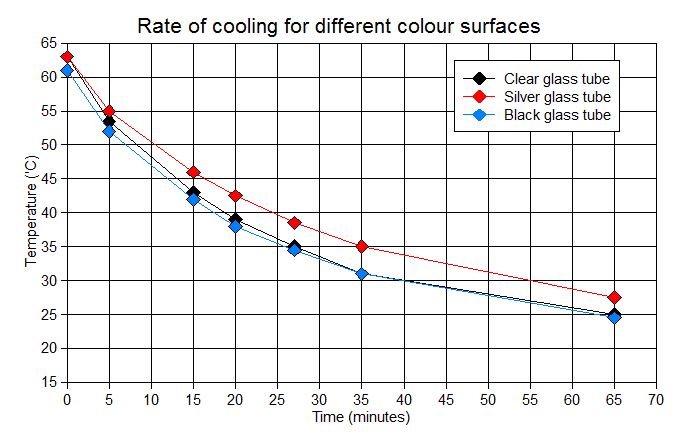
The graph shows that the differences in the rates of cooling are fairly small but clearly the shiny silver tube cooled the slowest as its curve was always above the curves for the other two tubes.
You may notice that the silver tube started the experiment 1 °C hotter than the other two tubes but you should also notice that at one point (after 35 minutes) it was 4 °C hotter owing to its slower rate of cooling.
The pattern of cooling rates for different surface colours and textures is exactly the same as the pattern for heating rates: that is to say, dull black objects cool down fastest and shiny silver objects cool down slowest. When combined with the heating results, full details of which are here, we can say that dull black objects undergo the greatest temperature changes whereas shiny silver objects remain within a smaller range of temperatures.
Details of this experiment are in your CGP Complete Revision and Practice book, on p86. You might also like to find out about Leslie’s Cube, which is a metal box that has a different surface on each side so that the differences in infra-red (heat) radiation can be compared in an even more controlled way. BBC Bitesize has a good description of the Leslie’s Cube experiment, here. There is also an explanation on schoolphysics.co.uk, which includes mention of Crooke’s Radiometer (the apparatus with white and black panels that go around inside a glass bulb when subjected to strong sunlight). You can read more here.
Incidentally, if you look back at the cooling curves you should notice that all three boiling tubes had the greatest temperature drops at the start of the experiment, when the water temperature was highest, and all three cooled much more slowly as the water approached room temperature. This is typical cooling behaviour and is a pattern of temperature change that you should be able to describe.
